Very interesting. But Nate made a number of assumptions in his simulation that I thought it would be fun to experiment with. Also, I've been meaning to learn about the Google Chart API that my homie Matt Cutts is always carrying on about.
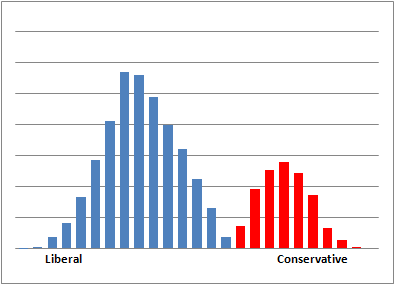
The first thing to do is to replicate Nate's results. It should be easy because Nate was very clear about what his simulation was doing. Here's what I got:
My results look similar; it seems I have faithfully replicated Nate's simulation, so now I can move on to some variations.
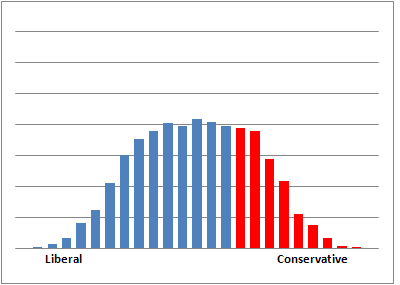
The first assumption I wanted to question was the uniform distribution of voters and candidates. Nate assumed that voters (and candidates) were uniformly distributed: every bin--from far left to far right and everything in between--has the same number of voters/candidates. In real life, it is more common to see a normal distribution (that's why the call it normal). I reran the simulation with voters and candidates chosen from a normal distribution. For the Democrats, instead of being uniformly distributed from 1--60, they are normally distributed with mean 30 and standard deviation 15 (which means that 95% should fall within the 1--60 range). The Republicans, instead of being uniformly distributed from 61-100, are normally distributed with mean 80 and standard deviation 10. Here's how the simulation comes out:
That's not got much Lieberman in it! The two party primary results are shifted left; the Democrats make better use of their majority status and win more often because both voters and candidates are more tightly clustered around the mean. For the jungle primary, the gap in the middle is back--say it ain't so, Joe--although the dip is not so severe. (Why are there purplish bars? Because some bins have both Democrat and Republican winners and I color-code accordingly. In my model it is possible for a Democrat to be more conservative than a Republican.)
Let's see how robust the result is. In the following charts we keep the means the same but double the standard deviations to 30 and 20, respectively:
The two-party primary gives about what I'd expect--similar results, but more spread out. The jungle primary results are so spread out that the dip in the middle is gone; the Liebermans are back, but so are a few of the extremists.
Now let's question another assumption. In my simulations the voter pool consists of two superimposed normal distributions, one for Democrats and one for Republicans. That is an appropriate model if you think party affiliation is a strong inherent property of the voter: to sample fairly from the pool of voters, we first sample D or R (or if you prefer liberal/conservative, or whatever labels you want to put on it), and then we represent the normally distributed variation within the label. That gives us the voter distribution shown below left.
But what if party afffiliation is not inherent? What if we first sample voters from a single pool of political views (we'll use a mean of 50 and a standard deviation of 20) and then each voter chooses to affiliate with a party based on their views (rather than having views based on their party). Since we are simulating California, that means that the left-most 60% identify with Democrats. Then we get a voter distribution as shown below right.
Now let's simulate the two election types with this single pool of voters:
Now the Liebermans are back--it looks like we've got Lieberman, sausage, Lieberman, Lieberman, bacon, Lieberman, tomato and Lieberman. What's more, it doesn't seem to matter too much which primary system is used; the results are similar either way. The candidates we get are constrained to the center, and reflect the Democratic majority.
Good luck, and thanks, Nate, for an interesting point of discussion.